Association
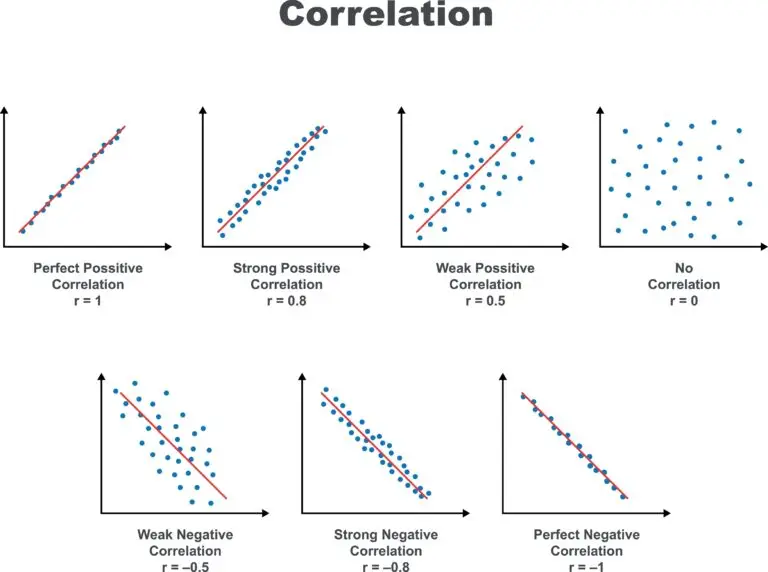
Table of Contents
What is Association?
In statistics and research, association refers to a statistical relationship or correlation between two or more variables.
An association indicates that changes in one variable are related to changes in another variable, either positively (as one variable increases, the other variable also increases) or negatively (as one variable increases, the other variable decreases).
Understanding associations is crucial in various fields, such as epidemiology, social sciences, economics, and psychology. For example, in epidemiology, associations between risk factors (e.g., smoking) and health outcomes (e.g., lung cancer) are studied to assess the impact of interventions and policies.
Types of Association
- Positive Association: When two variables are positively associated, an increase in one variable is associated with an increase in the other variable, and a decrease in one variable is associated with a decrease in the other variable.
- Negative Association: In contrast, negative association occurs when an increase in one variable is associated with a decrease in the other variable, and vice versa.
Strength of Association
The strength of association refers to how closely two variables are related. A strong association indicates a clear and consistent relationship between variables, while a weak association suggests a less pronounced or less consistent relationship.
Statistical measures such as correlation coefficients (e.g., Pearson correlation coefficient, Spearman rank correlation coefficient) are used to quantify the strength and direction of association between variables.
Interpretation of Association
Association does not imply causation. Just because two variables are associated does not mean that changes in one variable cause changes in the other variable. Additional evidence, such as experimental studies or causal modeling, is needed to establish causality.
Associations can be spurious, meaning they appear to be significant but are actually due to confounding variables or random chance. Controlling for confounders and considering the context of the data are important when interpreting associations.
Visualizing Association
- Scatter plots are commonly used to visually represent the association between two continuous variables. In a scatter plot, each data point represents a pair of values for the two variables, and the pattern of points can indicate the direction and strength of association.
- Line graphs or bar graphs can also be used to show associations between variables, especially when one variable is categorical and the other is continuous.
Limitations
Associations observed in data may be influenced by confounding variables, measurement errors, sample size, or other factors. Careful statistical analysis and consideration of potential biases are necessary when interpreting associations.
Related Links
Causation
Observational Study
Bias
Sample