Z-Score
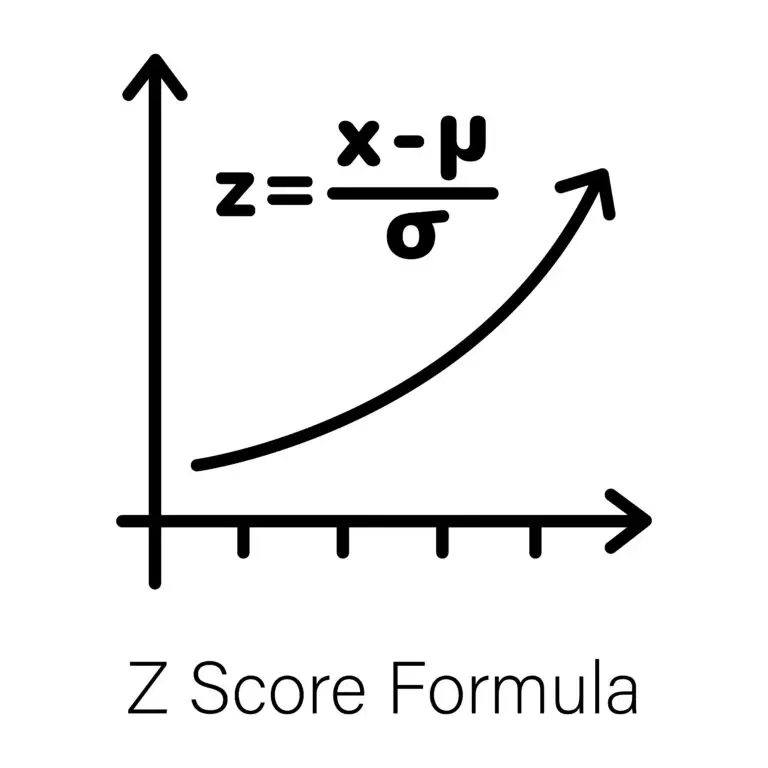
Table of Contents
What is a Z-Score?
A Z-score, also known as a standard score, is a statistical measure that indicates how many standard deviations a data point is from the mean of a dataset. It is used to standardize and compare data points from different distributions, allowing researchers to assess the relative position of a data point within its distribution.
Formula
- The formula to calculate the Z-score of a data point x in a dataset with mean \mu and standard deviation \sigma is: Z=\frac{x-\mu}{\sigma}
- Z is the Z-score, x is the data point, \mu is the mean of the dataset, and \sigma is the standard deviation of the dataset.
Interpretation
A positive Z-score indicates that the data point is above the mean, while a negative Z-score indicates that it is below the mean.
The magnitude of the Z-score indicates how far the data point is from the mean in terms of standard deviations. For example, a Z-score of 2 means the data point is two standard deviations above or below the mean.
Standardization
Z-scores standardize data, making it possible to compare data points from different distributions or datasets with different scales.
By converting data points to Z-scores, researchers can identify outliers, assess the relative position of a data point within a distribution, and conduct statistical analyses that require standardized data.
Use in Normal Distribution
Z-scores directly correspond to percentiles in a standard normal distribution (mean = 0, standard deviation = 1). For example, a Z-score of 1 corresponds to the 84th percentile, indicating that the data point is higher than approximately 84% of the data.
Z-scores allow researchers to determine the probability of obtaining a data point or range of values in a normal distribution, facilitating hypothesis testing and confidence interval calculations.
Applications
Z-scores are commonly used in fields such as psychology, education, finance, and quality control to assess performance, identify anomalies, compare measurements across different scales, and standardize data for analysis.
They are also used in statistical process control (SPC) to monitor and improve processes by analyzing deviations from the mean in manufacturing, healthcare, and other industries.
Limitations
Z-scores assume that the data follow a normal distribution. Other methods or transformations may be necessary if the data are not normally distributed.
Outliers can disproportionately affect Z-scores, especially in small datasets, so it’s important to consider the impact of extreme values on the interpretation of results.
Z-Score Example
The Scenario
Imagine we have a dataset of exam scores from a statistics class and want to calculate the Z-score for a particular student’s score.
Here are the details:
- Population Mean (μ): 75
- Population Standard Deviation (σ): 10
- Student’s Score (X): 85
Calculation
The Z-score formula is: Z=\frac{x-\mu}{\sigma}
Plugging in the values from our example:
Z=\frac{85-75}{10}
Z=\frac{10}{10}
Z=1
Interpreting Z-score
- A Z-score of 1 indicates that the student’s score is one standard deviation above the population mean.
- Positive Z-scores indicate scores above the mean, while negative Z-scores indicate scores below the mean.
- Z-scores allow us to compare scores from different datasets with different means and standard deviations on a standardized scale.
Related Links
Convenience Sampling
T-Test
Treatment Group
Type II Error